
Portion of Article posted HERE @ Seeitmarket

Market indices, closing lower than the weekly open to close out Q2 and week 26. Strong trending session 4/5 days as the pre-holiday session to end off the week and close out the books. Volatile price action mid-week which gave no opportunity to hold on for the ride down (recap which may be found here).
VIX levels maintaining in the 10-11 range as we head into week 27 and tempo in the summer doldrums beginning but overall daily volume not too shabby. Q2 out the door as we roll into Q3 and earnings season upon us for the next 6 weeks. Watch for the permabears beating their drum of the doom and gloom that lies ahead.
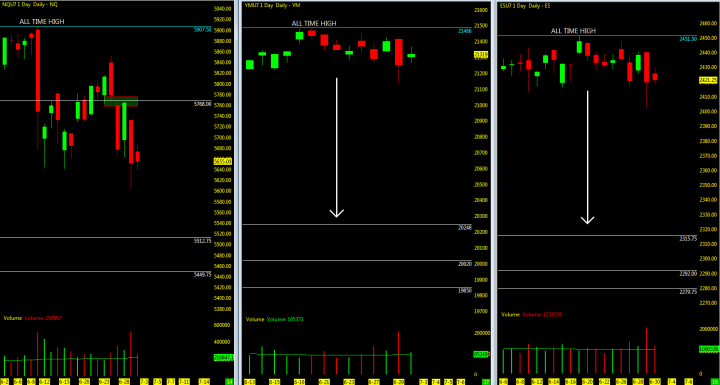
FANG/FAAMG stocks remain steady as the YM/ES remain consolidated. NQ all over the place and losing it’s relentless drive upside. Overall JUNE economic data not as strong as we wish it to be, needs to pick up significantly in conjunction with good earnings for Q2. Combined with summer momentum, the probability of a pullback seems to be building.
Technically, the indices open gaps remain below and viable targets for a pullback on all three. The ES/YM further downside may be the summer targets as price action wallows around the key moving averages and appears to be losing its hold on the NQ. As always be ready for both directions in the unpredictable market.
Key events in the market this week include Q3 start, FOMC minutes, ADP, non-farm Payrolls and earnings season approaching.
Technical momentum probability REMAINS in a UPTREND on the bigger pic as we hold above the key moving averages with room for correction leading on the NQ. As always, BEWARE of the catalyst wrench (Washington Politics) that looms overhead of if and when the market may sell off in reaction to unsettling news.
————————-

Overall looking for a summer pullback/correction and then regain traction back upside.
NQ losing support at the 10/50ma and sitting at @ the 50% Daily MML with two immediate open gaps below watch for the MML zone low support and 200ma. Momentum upside to regain above 10ema and close out open gap upside. Decision time and will lead out towards later part of the week.
ES/YM maintaining it’s momentum upside, REMAINS in consolidation around the 10/50 period moving averages. Deeper pullback on the ES will retest 50% MML and lower to the 200ma. YM look for support downside at the 50. Momentum upside look to the highs on the breakout back to all time highs.
I will notify through social media and my daily outlook; posted 30 minutes prior to the US open of any updates throughout the week.
Attempting to determine which way a market will go on any given day is merely a guess in which some will get it right and some will get it wrong. Being prepared in either direction intraday for the strongest probable trend is by plotting your longer term charts and utilizing an indicator of choice on the lower time frame to identify the setup and remaining in the trade that much longer. Any chart posted here is merely a snapshot of current technical momentum and not indicative of where price may lead forward.
NQ – Nasdaq Futures
Technical Momentum: UPTREND Pullback
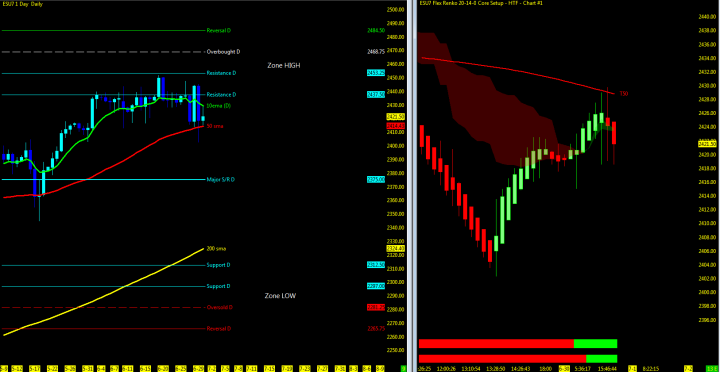
Using the Murray Math Level (MML) charts on higher time frames can be a useful market internal tool as price action moves amongst fractal levels from hourly to daily charts. Confluence of levels may be levels of support/resistance or opportunities for a breakout move.
- Multiple MML Overlay (DAILY and RANGE)

Lowest Open Gap: 4017
ES – S&P Futures
Technical Momentum: UPTREND Consolidation
- Multiple MML Overlay (DAILY and RANGE)
Lowest Open Gap: 1860.75
YM – DOW Futures
Technical Momentum: UPTREND Consolidation
- Multiple MML Overlay (DAILY and RANGE)

Lowest Open Gap: 15924
IJR – Small Cap ETF
Technical Momentum: UPTREND
- Buy Point: 53.7 (107.4 prior to split)
- Gain: 30.56%
- Price Split (1.19.17)
TQQQ – Proshare UltraPr0
Technical Momentum: UPTREND
- Original Buy Point: 69.97
- April 2017: Added shares; 79.225 Cost Basis
- July 2017: Sell shares;
- Gain: 23.27%
ETF Sectors
Coming soon in Q3
As always, leave your bias at the door of where you think the market should be, watch the charts in front of you and stay away from the Z-Vals. Be ready in both directions. Trend will reveal itself on Heikin Ashi bars and proper trade management will keep you in the trend.
Thanks for reading and remember to always use a stop at/around key technical trend levels.
Don’t forget to view the end-of-the-day charts as momentum in the markets can shift substantially from day to day and reset any charts posted above.
Government Required Risk Disclaimer and Disclosure Statement
CFTC RULE 4.41 – HYPOTHETICAL OR SIMULATED PERFORMANCE RESULTS HAVE CERTAIN LIMITATIONS. UNLIKE AN ACTUAL PERFORMANCE RECORD, SIMULATED RESULTS DO NOT REPRESENT ACTUAL TRADING. ALSO, SINCE THE TRADES HAVE NOT BEEN EXECUTED, THE RESULTS MAY HAVE UNDER-OR-OVER COMPENSATED FOR THE IMPACT, IF ANY, OF CERTAIN MARKET FACTORS, SUCH AS LACK OF LIQUIDITY. SIMULATED TRADING PROGRAMS IN GENERAL ARE ALSO SUBJECT TO THE FACT THAT THEY ARE DESIGNED WITH THE BENEFIT OF HINDSIGHT. NO REPRESENTATION IS BEING MADE THAT ANY ACCOUNT WILL OR IS LIKELY TO ACHIEVE PROFIT OR LOSSES SIMILAR TO THOSE SHOWN. oe
