Looking at the week behind 1 day @ a time…..
Good trading is always going back over the trading day and reviewing the setups that may or may not have worked out and what kept you in or perhaps took you out too early. Looking for the trend move and remaining in the trade is the objective. It’s your patience and discipline that will continue to grow as a trader when you implement such tools.
Market Traded: YM, ES, NQ (RTH)
Weekly Total: 4 setups; 93 Ticks NET ( NQ: 61 | ES: 20 | YM: 12)
Econ Data
Reported as current release and in relation to (previous months data).
- Housing Market Index: INCREASE
Kenneth Polcari Newsletter Highlights
Nasdaq is trading at 24 x trailing earnings – now while that is above the average of 20 x it is well below the multiple of 59 x that we saw back in 1999 before the dot com implosion……. The S&P is trading at about 20 x…trailing earnings…..which is 33% higher than the average…but remember – rates are still near zero with little expectation that this is going to change anytime soon…..so these readings to make some sense – but does not mean you go blindly into the night…..and if the cycle has in fact really stabilized and if the FED does nothing – then the mkt could continue to churn higher…
CLICK HERE to read more of his daily newsletter and subscribe
Daily Stats
- 3 Markets.
- 4 Setups.
- 93 Ticks
- NQ: 61 Ticks
- YM: 12 Ticks
- ES: 20 Ticks (12/8)
Session Highlights
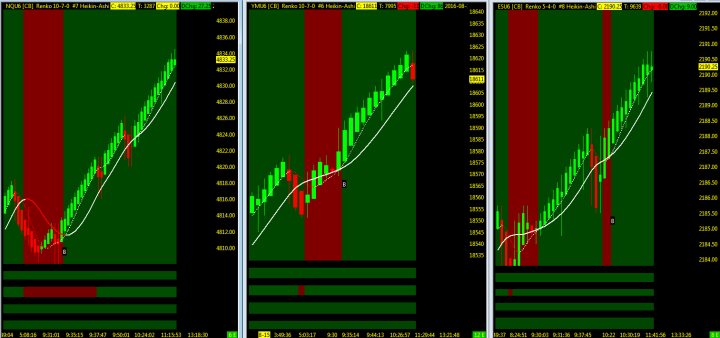
- Trend #1
- Overall trend of the day: UPTREND
- Fib projections levels hit:
- UPSIDE: NQ; YM; ES
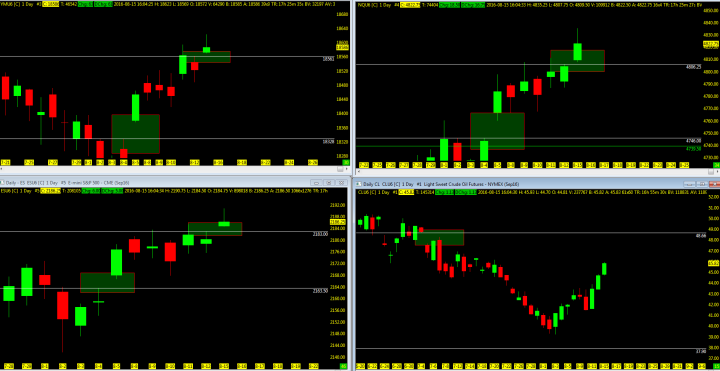
Full Session Chart

Trend Highlights
Trend #1
—————————————-
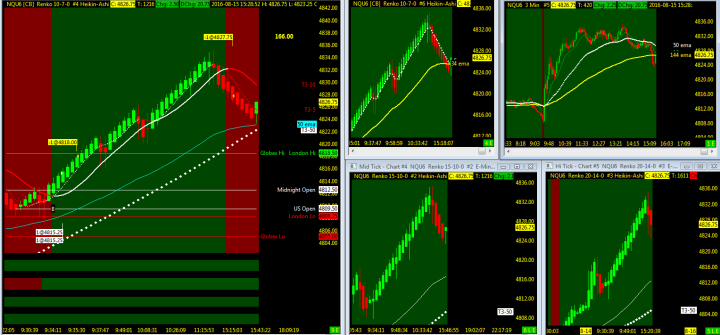
Setup Highlights
Setup #1
- ES

- NQ
—————————————-
RTH Closing Charts
- Volume:
- ABOVE Average:
- BELOW Average: YM/NQ/ES
- Price above 50/200 moving averages on all 3 indices
- 4 hour Big Pic: UPTREND
- T3 Moving Averages:
- NQ: UPTREND
- YM: UPTREND
- ES: UPTREND
- T3-50: ALL 3 above
- T3 Moving Averages:
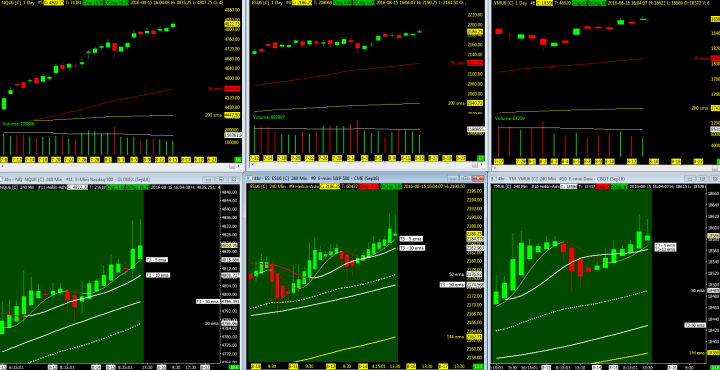
Top Row: Daily chart with supporting 50/200ma and volume based on a 60 day moving average
Bottom Row: 4 hour chart. T3 moving averages. 50/144ema.
———————————
Open Gaps
- Remain below on indices
- Above/below on Crude
- No gaps closed out today
- New gaps formed form previous session